
African immigrants in Prince George’s County, Maryland, now number 61,443. That puts the county third among all U.S. counties, behind Harris County, Texas, and its neighbor Montgomery County. The count comes from a Planning Data Journal released by the county’s Planning Department in 2026, which looks at Census Bureau estimates for 2024 and compares them with 2010.
The numbers behind the headline
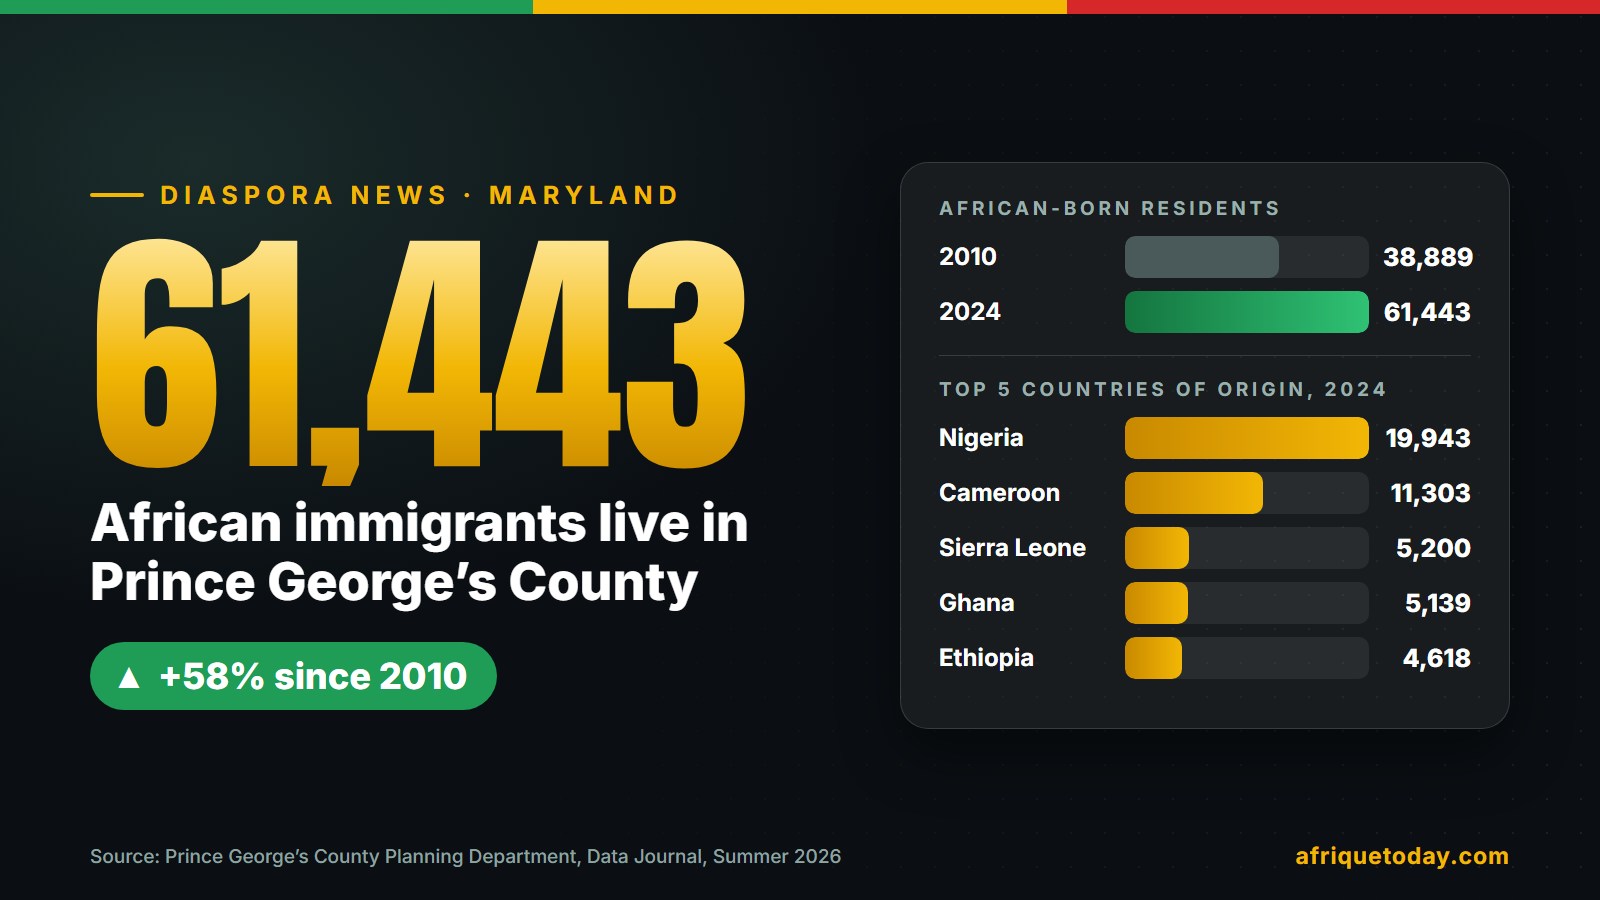
- 61,443 African-born residents in 2024, against 38,889 in 2010. That is 22,554 more people, an increase of 58% in fourteen years.
- About one in four foreign-born residents of the county was born in Africa (25.3% of 242,379 people).
- Nationally, Harris County, Texas ranks first with 76,731 African-born residents. Montgomery County, Maryland, is second with 62,763, just ahead of Prince George’s. Two counties of the DMV area are therefore in the national top three.
- More than 88% of the community arrived in the United States in 1990 or later.
Where the community comes from
West Africa dominates: about 37,400 of the 61,443 residents, or roughly six in ten, were born in a West African country. Nigeria is the largest origin by a wide margin (19,943), followed by Cameroon (11,303), Sierra Leone (5,200), Ghana (5,139) and Ethiopia (4,618).
The biggest change since 2010 is Cameroon. The Cameroonian-born population has nearly tripled, from 3,896 to 11,303, moving it from third to second place.
Where people live
The community is concentrated in the north and east of the county. Two areas stand out with almost the same size: the one around Laurel, Greenbelt and Beltsville (14,438 residents) and the one around Bowie, Kettering and Largo (14,363). Together they hold close to half of all African-born residents of the county.
The fastest growth is elsewhere. The central area (Seat Pleasant, Capitol Heights and Landover) saw its African-born population more than triple, from 2,059 to 6,344, and the south (Clinton, Fort Washington and Rosaryville) more than doubled.
Education, income and housing
- Education: in six of the county’s seven statistical areas, the share of African-born adults with a bachelor’s degree or more is above the county average of 37.6%. In the Bowie and Largo area it reaches 52.9%.
- Income: in most areas, average household income among African immigrants is higher than the county average of $125,138. The Bowie and Largo area leads at $168,251.
- English: in 93% of African immigrant households, at least one person speaks English only or speaks it very well.
- Housing: the homeownership rate in the community fell from 60.9% in 2010 to 55.5% in 2024, below the county rate of 62.3%. It is much higher outside the Beltway than inside it.
Why it matters for the diaspora
These figures describe a large, well-educated and mostly English-speaking community spread across several towns within a short drive of Washington, DC. For associations, entrepreneurs and event organizers, that is a sizable local audience. It also explains why cultural dates keep multiplying in the area: the county and the Maryland-National Capital Park and Planning Commission host the Celebrate Africa Festival every September, during African Heritage Month.
If you are looking for something to do next, see our coverage of two upcoming events: the 5th anniversary of The Exquisite Black & White on October 17 in Takoma Park and Henri Dikongue and Aladji Touré at the African Awards of Washington on November 27.
About the data
The figures are American Community Survey 5-year estimates for 2010 and 2024. They come from a sample of households, so they carry a margin of error, especially for smaller groups. The county itself advises caution when comparing small communities. This article is our own summary; read the original publication for the full tables: African Immigrants in Prince George’s County, Planning Data Journal, Summer 2026 (PDF), Prince George’s County Planning Department.
Frequently asked questions
How many African immigrants live in Prince George’s County?
According to the county’s 2026 Planning Data Journal, 61,443 residents were born in Africa in 2024, up 58% from 2010.
Which African countries do most residents come from?
Nigeria (19,943), Cameroon (11,303), Sierra Leone (5,200), Ghana (5,139) and Ethiopia (4,618).
Which Maryland county has the most African immigrants?
Montgomery County has slightly more, with 62,763, followed by Prince George’s County with 61,443. Both rank in the national top three.